🩺 Can a Smart Ring Track Blood Pressure? Oura Ring 5 vs Hilo: 4 Months of Data
With the Ring 5, Oura started showing how much your blood pressure drops at night. I compared it with the Hilo BP monitor for four months: single nights don’t match – the long-term trend does.

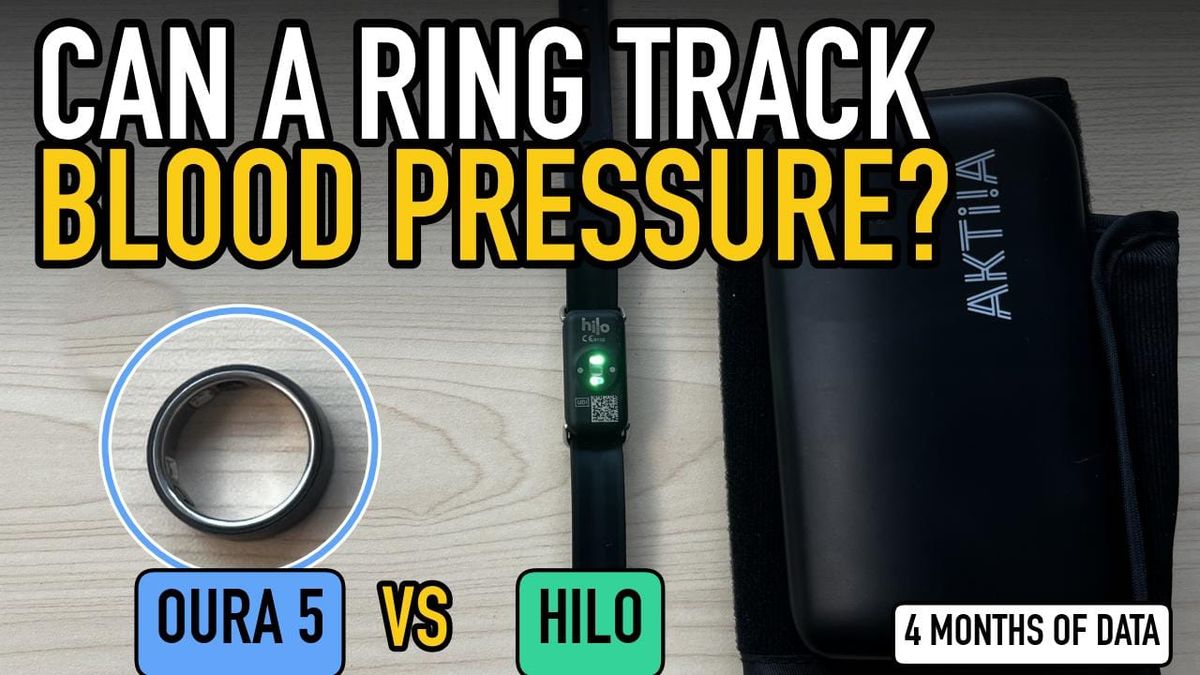
Along with the Oura Ring 5 (on sale since June 2026), Oura added a new Heart Health section to its app – and with it, three features built around blood pressure (BP).
- The good news: they work on every ring from Gen3 up (Gen3, Ring 4 and Ring 5) with an active membership.
- The catch: officially they’re only available in the US, India and the UAE – although it looks like Oura is currently rolling them out to the EU, the UK, Canada and 30+ more markets (from October 6, 2026).
For four months (June 1 – September 30, 2026) I wore the Oura Ring 5 together with Hilo, an optical blood pressure monitor for the wrist. Here’s what I found.
🩸 Blood pressure in a nutshell
Blood pressure is the force your blood puts on the walls of your arteries. It’s measured in millimetres of mercury (mmHg) and always given as two numbers: systolic (when the heart contracts) and diastolic (between beats). So 120/80 means 120 mmHg during a heartbeat and 80 mmHg while the heart relaxes.
Why does it matter? High blood pressure (hypertension) is one of the biggest risk factors for heart attack, stroke and kidney disease – and it usually causes no symptoms. According to the WHO, about 1.3 billion adults have hypertension and almost half of them don’t know it. Where the line sits depends on the side of the Atlantic: in Europe (ESC 2024) hypertension starts at 140/90 in the doctor’s office, while US guidelines (AHA/ACC) already call 130/80 stage 1 hypertension.
How blood pressure is measured:
- Invasively – a catheter placed directly in an artery measures pressure beat by beat. The gold standard, but only in hospitals (ICU, surgery).
- Auscultatory – a cuff and a stethoscope: the first sound you hear marks the systolic pressure, the moment the sounds disappear marks the diastolic. In most clinics automated devices have taken over (mercury devices are being phased out), but it’s still the reference method for validating BP monitors.
- Oscillometric – the automatic cuff you have at home, at the doctor’s, or as a 24-hour ambulatory monitor (ABPM). As it deflates, it picks up tiny oscillations of the artery and an algorithm calculates the pressure – which is why every model has to be validated (see the list at STRIDE BP).
- Cuffless (optical PPG sensor) – rings and watches don’t measure blood pressure, they estimate it from the pulse wave: from its shape (Oura, Hilo) or from how long it lags behind the ECG – the pulse transit time, PTT (Circular Ring 2). The estimate is calibrated with a cuff, and the European Society of Hypertension doesn’t recommend it for diagnosis yet.
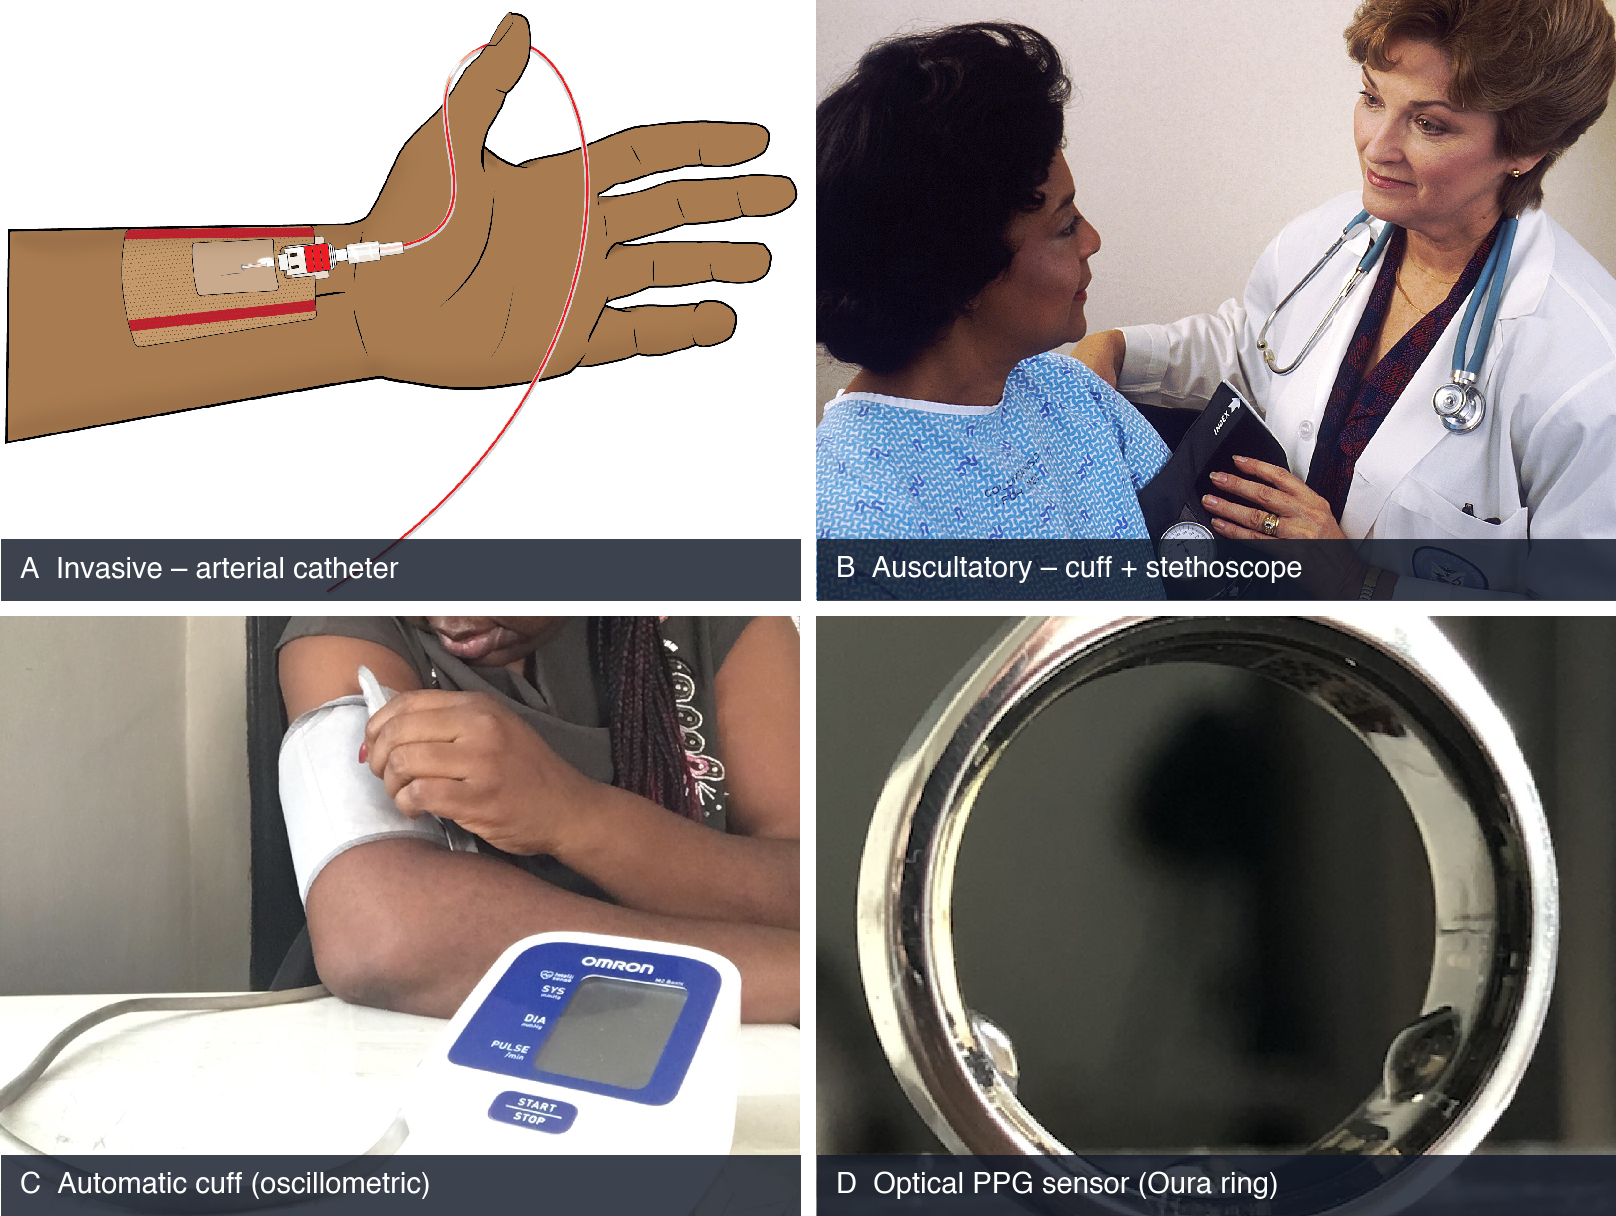
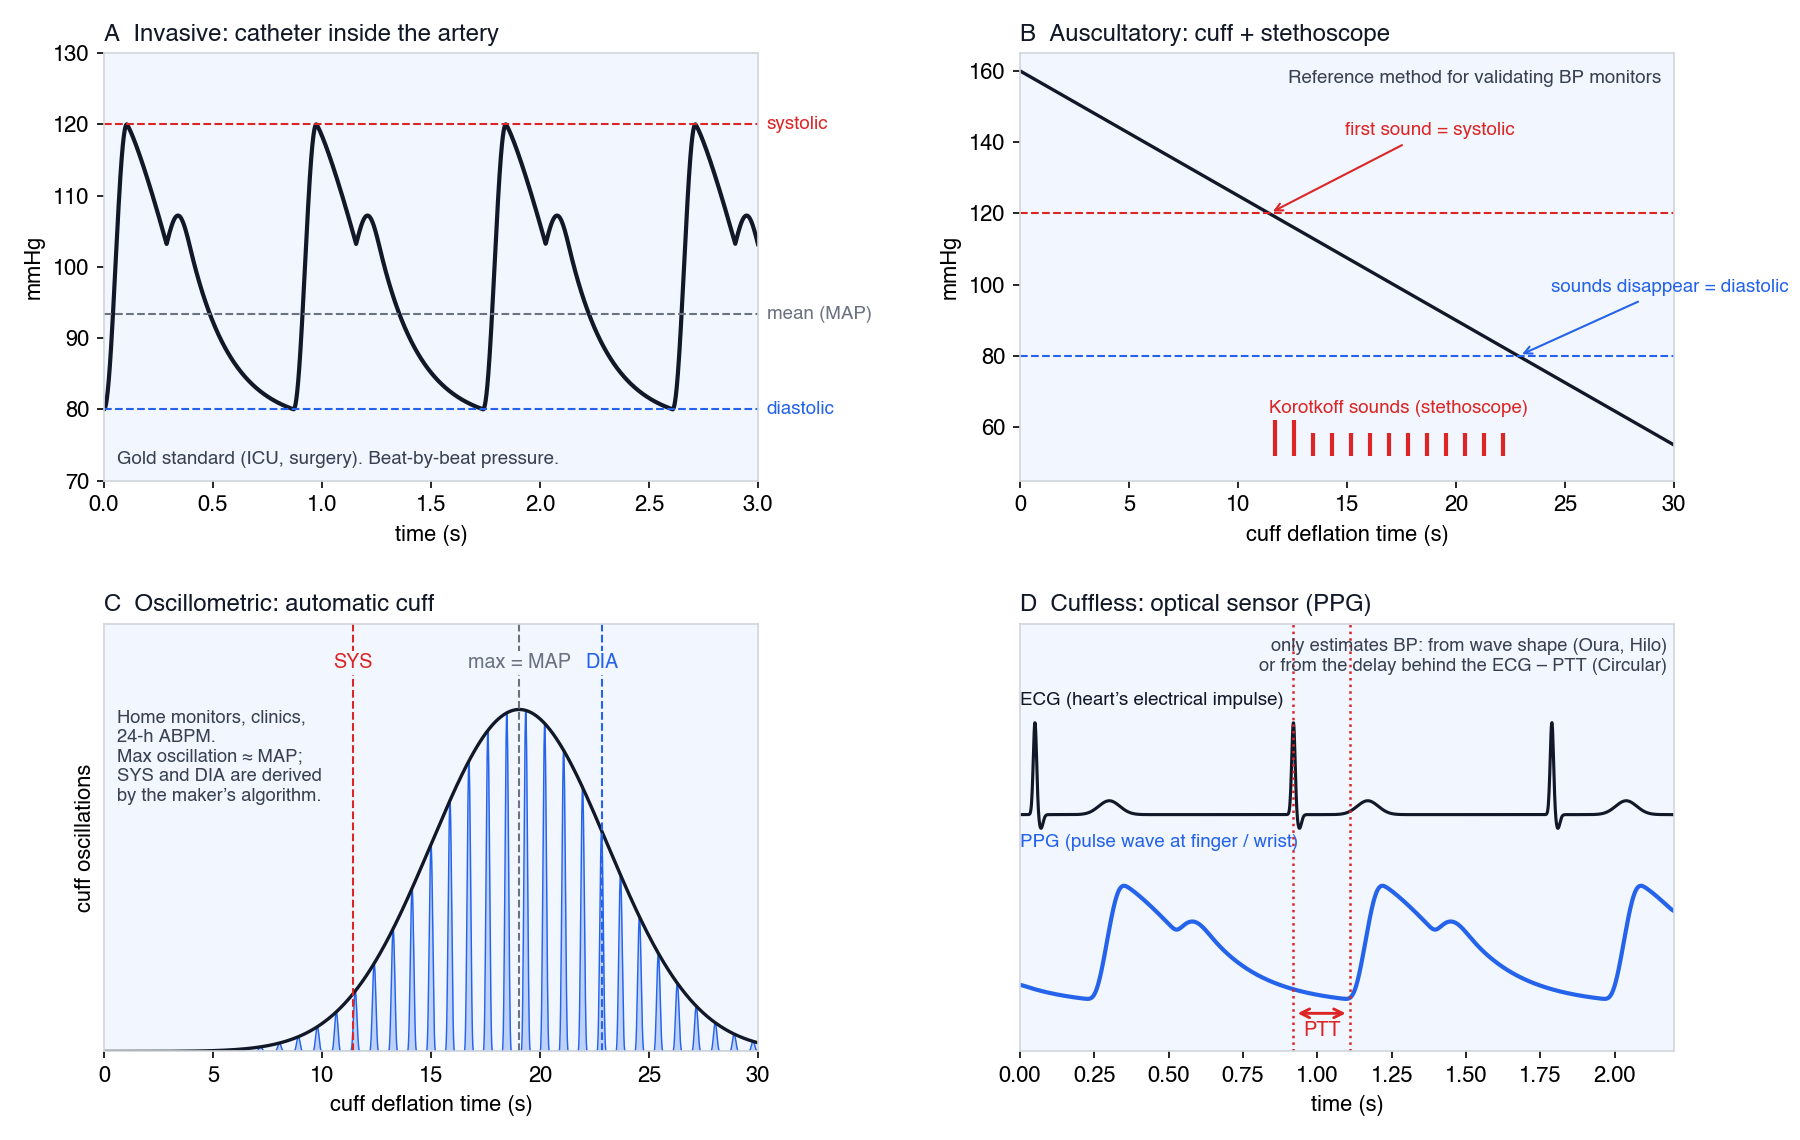
There are a few more specialised methods (continuous finger cuffs, tonometry), but they’re mostly used in research and hospitals. A good overview: Ogedegbe & Pickering, Principles and techniques of blood pressure measurement (2010).
💍 What does Oura offer for blood pressure?
As mentioned, there are three BP features:
- Blood Pressure Signals – part of Health Radar
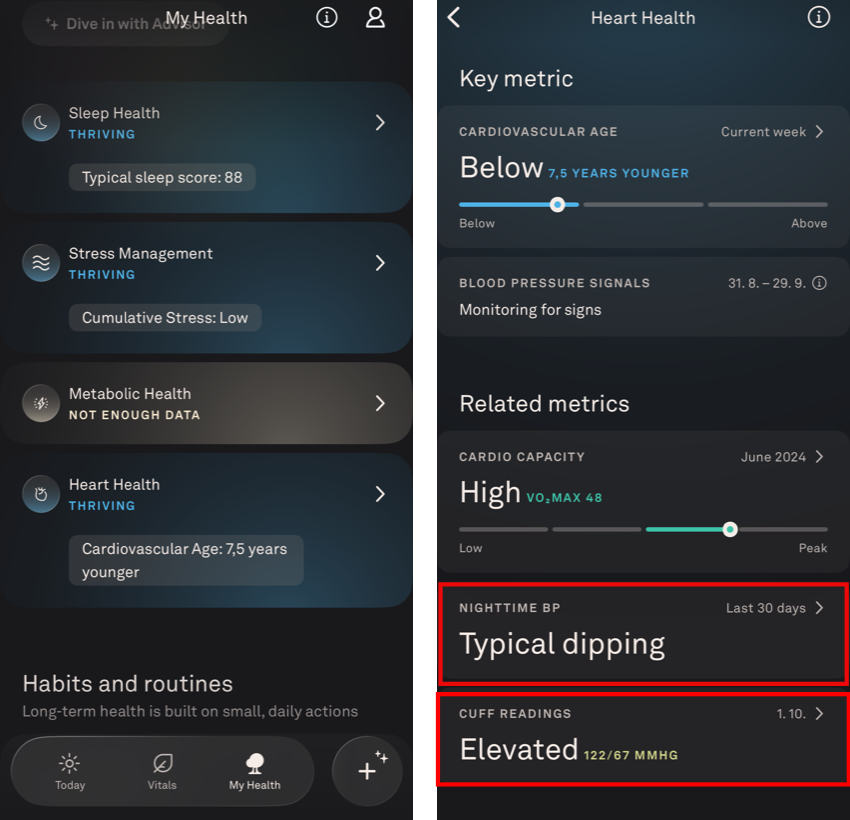
- Nighttime BP – under My Health → Heart Health
- Cuff Readings – under My Health → Heart Health
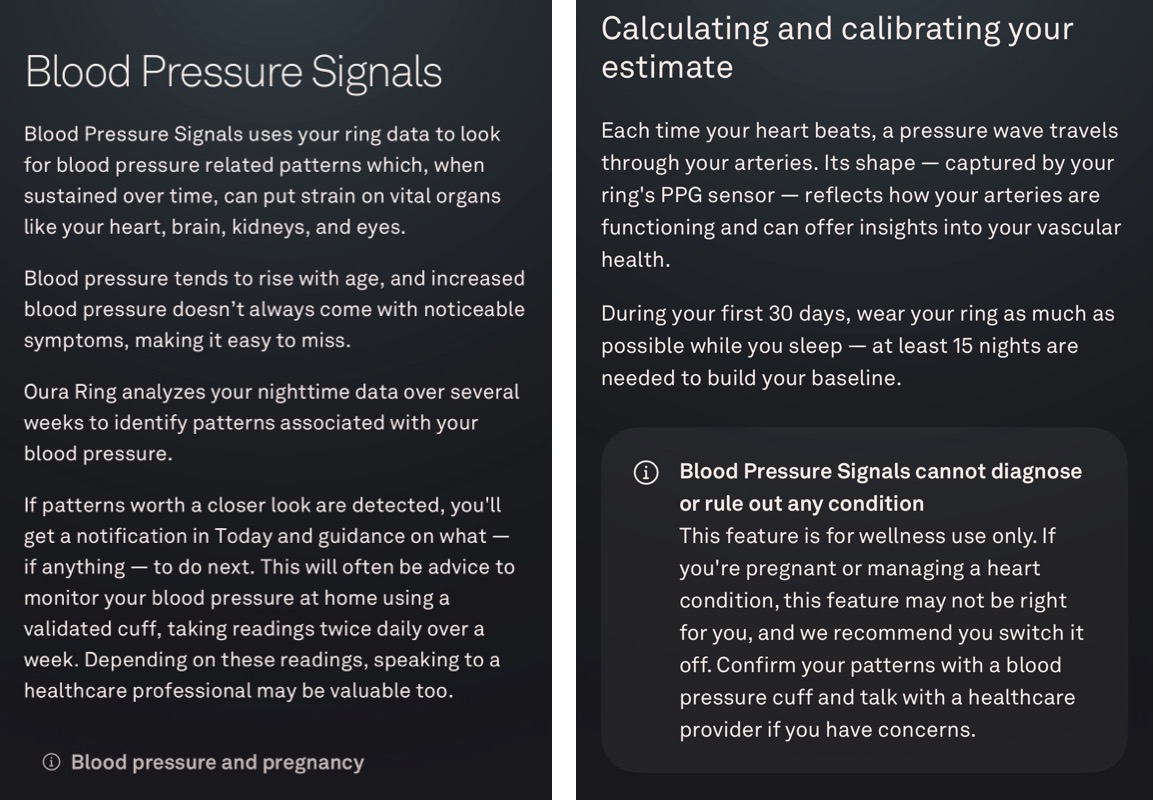
1) Blood Pressure Signals
This one runs in the background. According to Oura, it looks at your nighttime ring data in 30-day windows and searches for patterns linked to blood pressure that might point to trouble. It needs at least 15 nights out of the last 30 to build your personal baseline. It works much like Symptom Radar does for an oncoming illness – and in fact both live under the same umbrella: Health Radar groups Symptom Radar (short-term strain) with Nighttime Breathing and Blood Pressure Signals (long-term patterns).
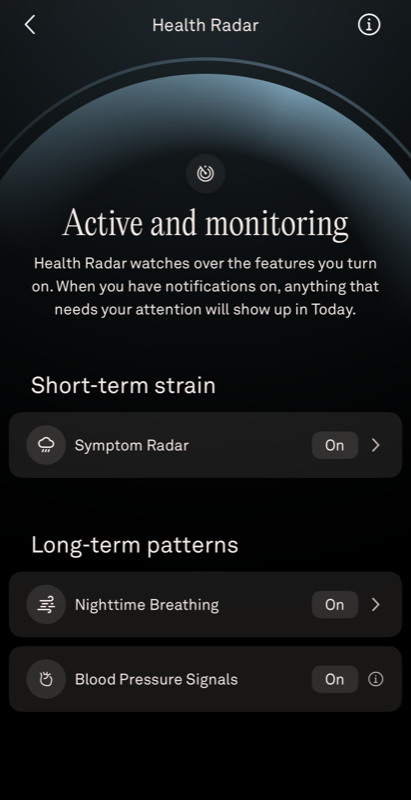
If it spots something, you get a notification in Today with a suggestion to check your BP with a validated cuff twice a day for a week – and possibly see a doctor.
You won’t see any mmHg or score here. The Heart Health card only shows a status – in my case “Monitoring for signs” – and the period being evaluated. In four months I never got a single alert, which, given my blood pressure (more on that below), is actually the right answer.
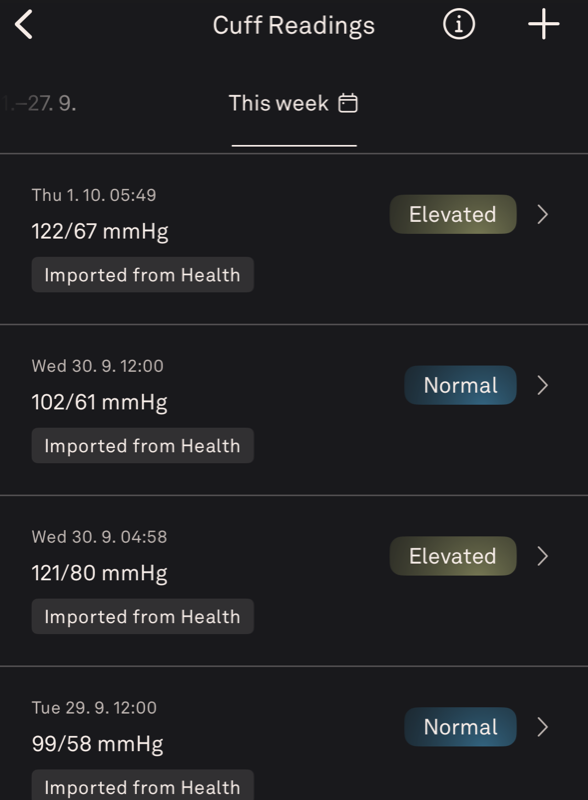
2) Cuff Readings
A simple log of readings from a regular blood pressure monitor. You can enter them manually or pull them in from Apple Health / Health Connect. Oura tags each reading using the American Heart Association categories (Normal / Elevated / High).
Important: these numbers don’t come from the ring, and according to Oura they don’t affect Blood Pressure Signals, Nighttime BP or any score. Only the Advisor chatbot uses them as context.
3) Nighttime BP
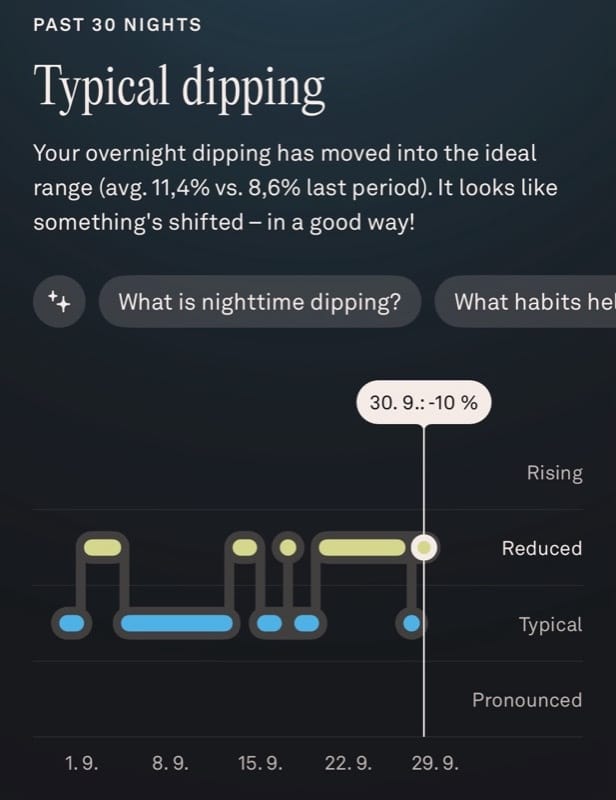
This is the only feature that gives you a regular BP-related output: by what percentage your blood pressure dropped during sleep, and which category that falls into.
And it’s not something Oura made up – it’s a well-established medical concept. “Dippers and non-dippers” were described by O’Brien et al. in The Lancet back in 1988, and the European Society of Hypertension guidelines for 24-hour BP monitoring work with it too. Oura uses the same thresholds:
| Oura category | Nighttime dip | Medical term |
|---|---|---|
| Typical | 10–20 % | dipper (normal) |
| Reduced | < 10 % | non-dipper |
| Pronounced | > 20 % | extreme dipper |
| Rising | BP went up | reverse dipper / riser |
Why should you care? In the large IDACO study (JAMA 2019, 11,135 people), nighttime and 24-hour blood pressure had the strongest link to mortality and cardiovascular events. The difference is how it’s measured: in medicine with a 24-hour ambulatory monitor (a cuff that inflates every 30–60 minutes at night and gives you mmHg), in Oura as an estimate from the optical sensor – without mmHg, so the output is the percentage drop:
Oura labels all three features as wellness features: they don’t diagnose or rule anything out, and Oura itself tells you to confirm any pattern with a cuff.
⌚ Hilo: what I compared Oura against
Hilo (formerly Aktiia) is a Swiss wristband that calculates blood pressure in mmHg from PPG. It’s calibrated with the cuff that comes in the box and takes readings on its own whenever you’re still (for me ~26 times a day, roughly every 40 minutes at night).
In the EU it’s a Class IIa medical device. Seated, it has good validation results, but nighttime is a known weak spot: an independent study by Tan et al. (2023) found it read nighttime systolic pressure 15.5 mmHg higher than an ambulatory monitor and underestimated the dip. Even Aktiia’s own 2025 study reports +12.5 mmHg at night and 79 % agreement on dipping status. So in this test Hilo is a benchmark, not a gold standard.
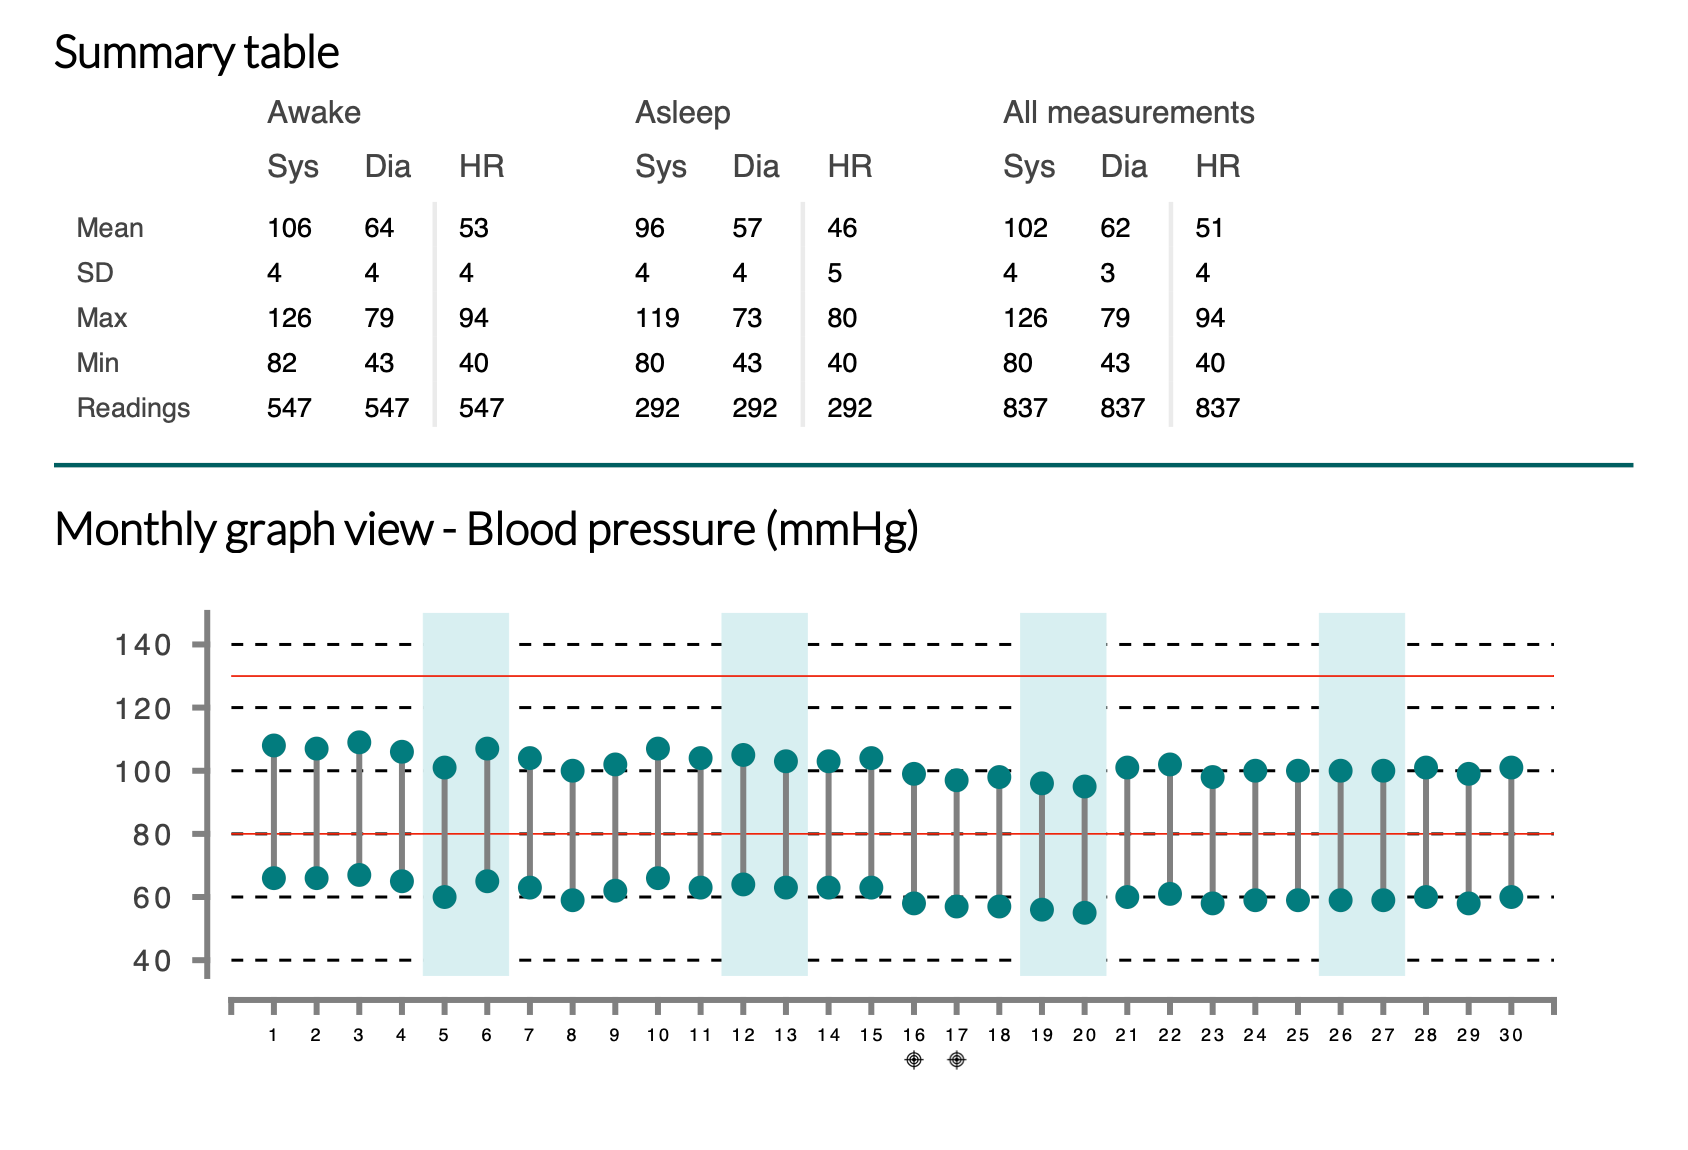
🔬 The test and my starting point
- 💍 Oura Ring 5: nighttime dip from 121 nights (screenshots from the app).
- ⌚ Hilo: 3,213 readings from the monthly reports. Hilo doesn’t show a per-night dip, so I calculated it with the standard ambulatory-monitoring formula (daytime vs sleep average) and checked it against Hilo’s own monthly summaries (June 11.6 % vs my 12.0 %, September 9.4 % vs 9.8 %).
What that means for the test:
1) Blood Pressure Signals had nothing to report, so I couldn’t test how well it catches hypertension.
2) It doesn’t affect the dip – mine varied from 0 to 19 % night to night, so there was plenty to compare.
📊 Results
1) Single nights: Oura and Hilo don’t agree
| 106 paired nights | Result |
|---|---|
| Average nighttime dip | Oura 9.7 % · Hilo 10.4 % |
| Night-by-night correlation | r = 0.11 (0.21 from July) |
| Mean difference | 4.1 percentage points |
| Same category | 57 % of nights (≈ coin flip) |
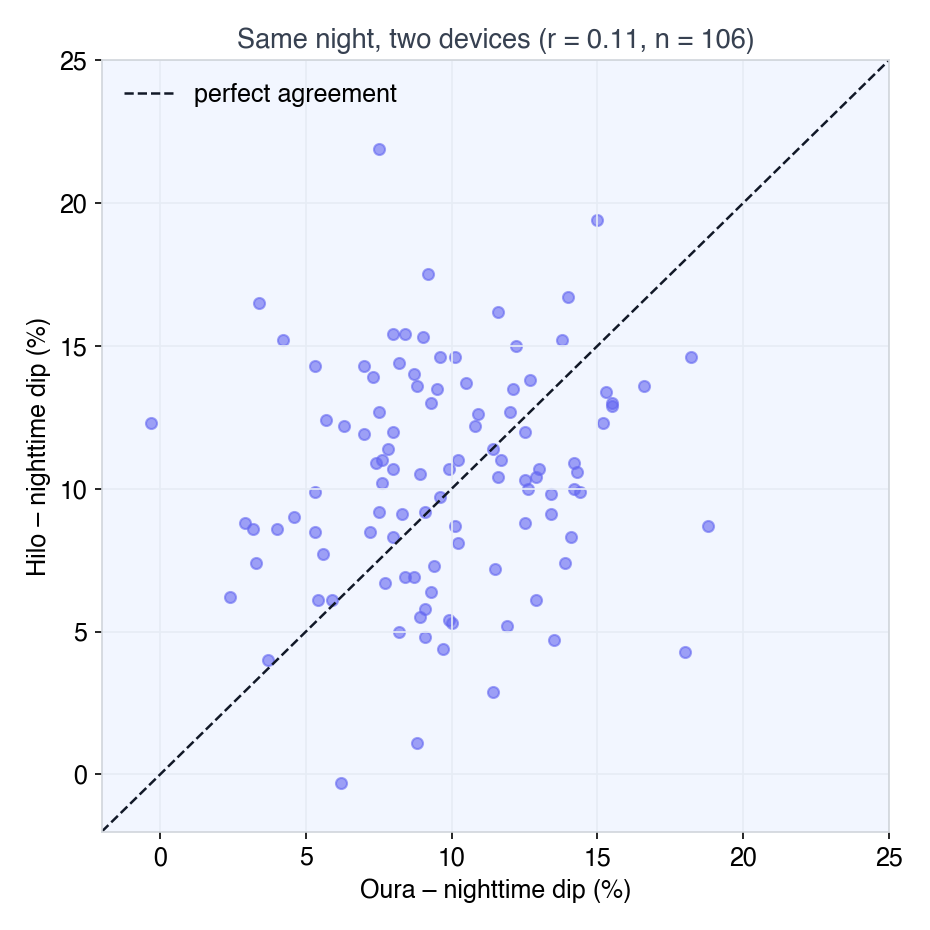
2) Long-term trend: this is where Oura and Hilo meet
Now the interesting part. When I compare 7-day averages instead of single nights, the picture changes: