Oura ring — TOP5 features
This article is primarily intended for 3rd generation Oura ring owners with basic user knowledge (i.e., the user knows how the ring works…

This article is primarily intended for 3rd generation Oura ring owners with basic user knowledge (i.e., the user knows how the ring works, what it measures, and is familiar with basic concepts such as HR, HRV, etc.).
My goal was to identify the TOP 5 most interesting functionalities, tips, and tricks based on my years of experience with this ring (or its previous generation).
Let’s look specifically at these topics:
- Metrics worth tracking — Readiness, HRV, Temperature, RHR
- Trends
- Battery
- Heart Rate
- Connectivity
1) Metrics worth monitoring
Readiness
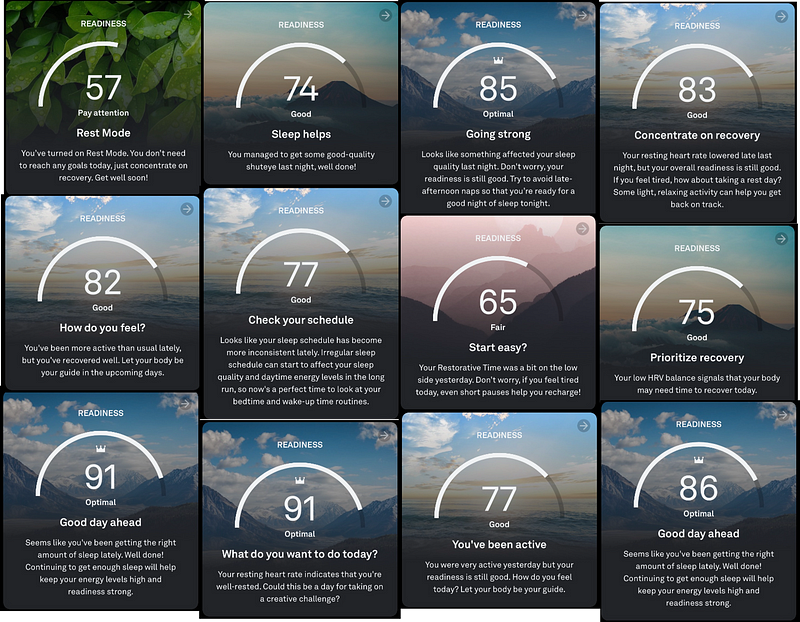
Readiness is the showcase of the application. It is the first number you will see in the app after syncing. It’s supposed to express your body’s level of readiness for the new day in the range of 0–100 (0 being the least, 100 being the most, >70 being considered good readiness).
Personally, I also appreciate the wide range of accompanying comments, which are mostly helpful and make sense.
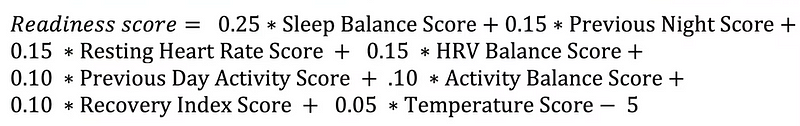
However, it is good to keep in mind that Readiness is just an “artificial” number based on a calculation (decoded from QS Rob, see below) into which other, also calculated numbers — scores from the areas of sleep, activity and stress — primarily enter.
Thus, Readiness is produced in this order:
Raw data (HR, HRV, temperature) -> Individual Scores -> Readiness
This is part of the reason why I love looking at the more raw data from the Oura ring — HRV, temperature, RHR — right after Readiness.
Great trio of raw data: HRV, temperature, RHR
As I’ve already outlined, after looking at Readiness, my steps usually follow the Readiness tab after these three metrics:
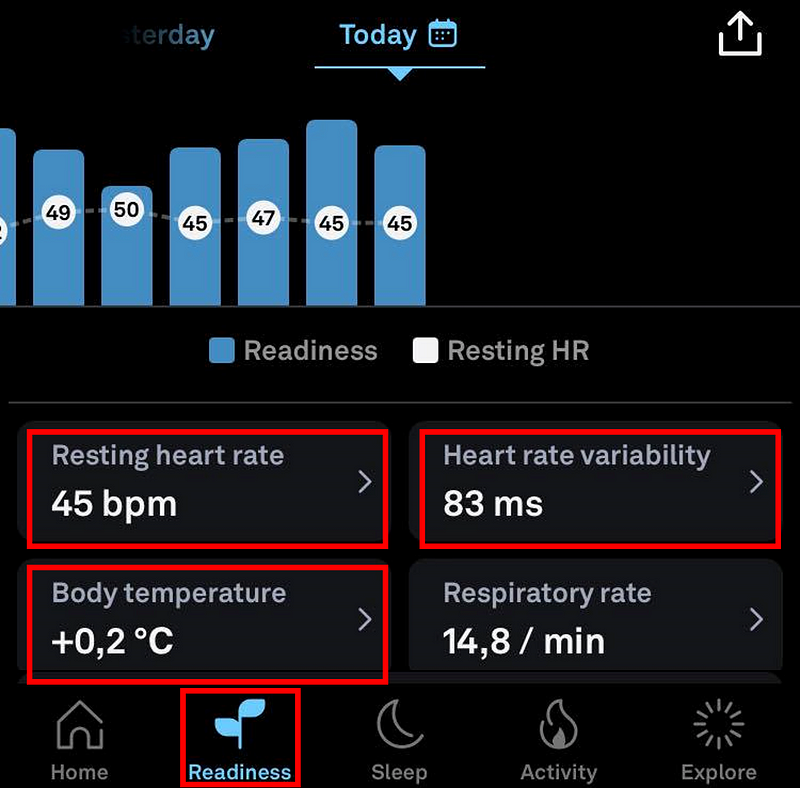
HRV (Heart Rate Variability) is the king, and temperature and RHR (Resting Heart Rate) are his hands of the king.
Regarding the HRV my approach is pretty simple, I know my current baseline (average), so I can have a look to see if I am above/below it for the previous night. If above, it’s a just good sign for me, if below, I consider why and whether I should take a so-called rest day.
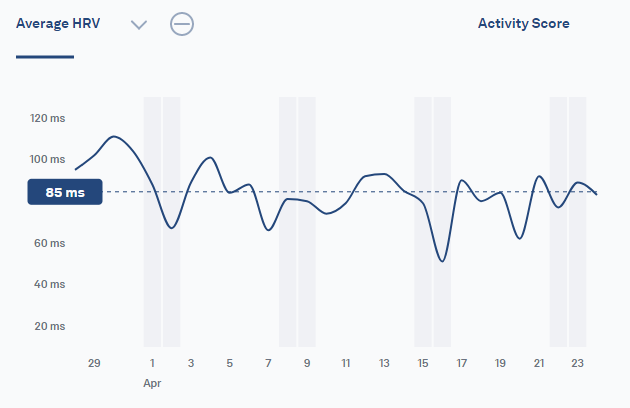
This is the nightly average HRV from the sleep course. The night time is ideal in terms of HRV measurement quality, the body is at rest, which is a testament to the accuracy of optical sensors that are prone to movement — especially in metrics where milliseconds play a major role.
But if you want to go deeper into this issue, it’s good to consider that sleep is a process. A regenerative and repairing process, you might say. Therefore, the measurement of night HRV can reflect the course of this process, e.g. that the body has struggled with the previous day’s exercise, late eating, alcohol, etc. However, nighttime HRV is not necessarily a crystal clear value for interpreting how successful the repair process was. This is getting outside the scope of the Oura ring, because there is an alternative to nighttime HRV measurement — daytime measurement — that Oura does not support. The daytime measurement ideally takes place first thing in the morning upon waking. For this option I currently use the chest band and the MySasy app. However, one can find other apps for daily measurements like HRV4Training, Elite HRV, etc.
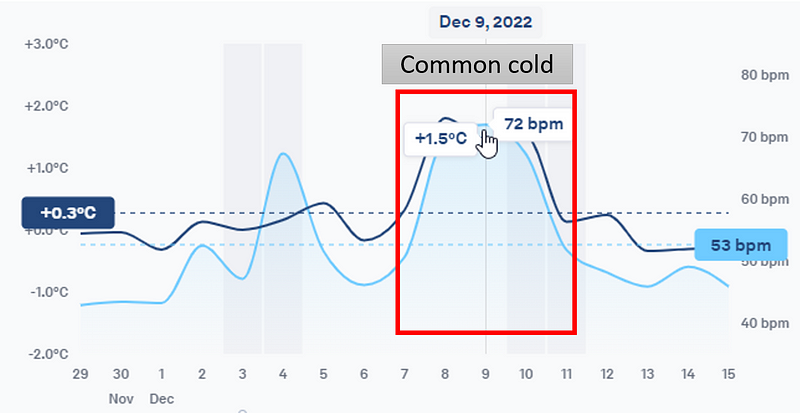
I also use the temperature and RHR as a self-reflection of my own readiness for the day (especially in terms of physical activity), so similar to HRV. Then furthermore, these 2 metrics are useful in the start and the end of common cold (or other sickness). So I can soon see, something is happing or later that these values are back to normal and I can return to training, see the example of a passing cold in the temperature and RHR variables:
Temperature functionality is also universally well regarded by the female community as an aid in monitoring the development (or prediction) of periods.
2) Trends
Moving away from the daily tracking of metrics I mentioned above, data can be very meaningful especially if you zoom out, i.e. trends. Trends are a great indicator of whether what you’re doing has any consistency. It’s up to everyone to detect their own insights, correlations (a cloud platform can help to calculate correlations), and causality.
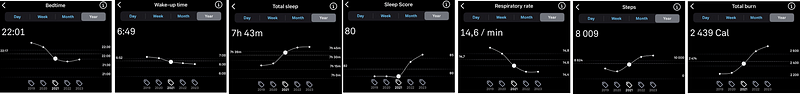
Personally, I like to zoom out to the max, i.e. months and years, so from my five years of using Oura, I would evaluate for example the following:
- I go to bed earlier and wake up earlier, increasing my total sleep time and also its quality (in the form of Sleep Score),
- I have prioritised breathing through the nose, which has led to a reduction in Respiratory Rate,
- I’m moving and exercising more, which is reflected in the Steps and Total burn metrics.
So, the statistic could be boring, but it has valuable data. You can work with such a picture, evaluate whether the trend is correct, whether it is sustainable, whether I am not working on deepening sleep deprivation or overtraining, etc.
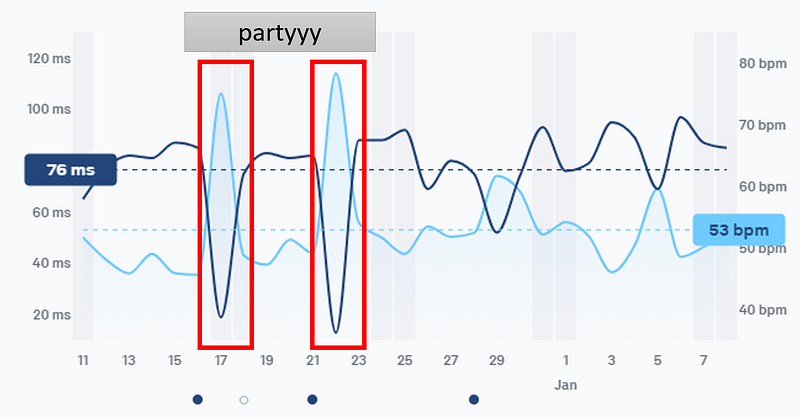
By the way, in a given period the graph of my alcohol consumption would definitely have a downward tendency, and this is also contributed to some extent by Oura and its AHA effect of alcohol on the body, a beautiful illustration being for example two alcohol Christmas parties that reliably shoot up the RHR and shoot down the HRV, which clearly speaks of the stress on the body:
3) Battery
Since the ring battery is not replaceable, it is a good idea to take good care of the battery. My tips are as follows:
- Charge regularly and keep the battery between 20–80%.
- Avoid large temperature differences. Do not take the ring to a sauna, for example.
- Turn off SPO2 — it’s good to test this functionality at some point, but if your readings are within normal range, I recommend turning off SPO2 monitoring. This is actually a standalone metric, so turning it off won’t affect other scores, etc.
- Airplane mode — it’s a shame that the Oura has no auto to turn on Airplane mode, so you need to turn this mode on manually, ideally in the evening. Its deactivation can then take place in the morning when charging.
4) Current HR (heart rate)
Oura does not currently (unlike e.g. Circular and RingConn) have live measurements (the “sessions” under the Explore tab may be an alternative).
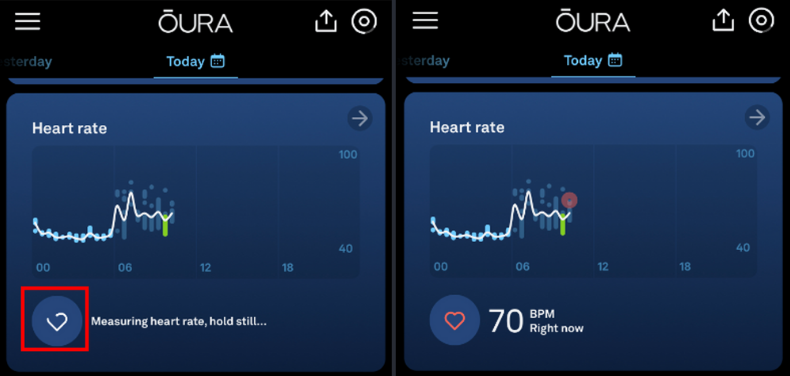
However, a current option, at least for measuring current HR, may be functionality that is a bit hidden, although available at a click within the home tab of the app.
Just scroll down a little lower on the Heart rate tile and click on the heart rate — and lo and behold, I can suddenly see my heart rate, which is also plotted on a graph.
5) Oura Cloud and other connectivity
I’ve already mentioned Oura Cloud, as a web-based graphical and highly developed platform, above. Oura Cloud has de facto 3 parts:
- Dashboard — which is basically a web version of all daily metrics, similar to the mobile app
- Trends — a very good platform for displaying two selected metrics in one chart for a selected period.
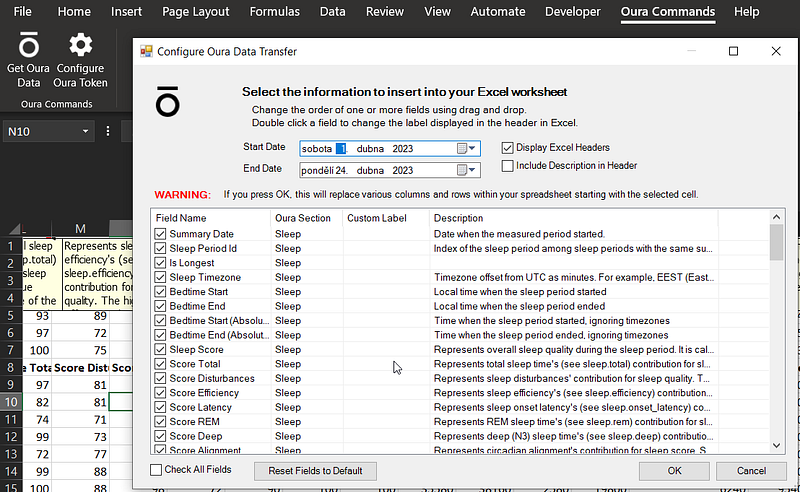
- API — a large variety of apps are able to extract data from Oura (I use Exist for example), which can be used to aggregate other data, from other sources. The spreadsheet king MS Excel can be a rather interesting alternative to work with the data yourself. There is an extension for it that will pull raw data via API directly into Excel. More here.
OURA 3 –40–50 EUR DISCOUNT — https://fitnesator.link/oura
CIRCULAR RING 8% DISCOUNT — https://fitnesator.link/circular
RINGCONN — https://fitnesator.link/ringconn
ULTRAHUMAN — https://fitnesator.link/ultrahuman